You already have valuable clues about what drives your business. They sit in your sales records, CRM, website reports, finance tools and day-to-day operations. The challenge is bringing those clues together and turning them into decisions you can act on.
Data analytics gives you a clearer view of what is happening, why it is happening and where to focus next. Instead of relying on instinct alone, you can use evidence to shape your next move, track whether it works and adjust with confidence.
That does not mean you need a complex analytics programme or a screen full of charts. Start with one useful question. Build from there.
Your business already owns more data than you think
Most organisations generate useful data as part of their everyday work. The information often lives across separate tools, teams and reports.
- Sales and CRM: leads, opportunities, conversion stages, deal value and customer history.
- Website and marketing: visits, enquiry forms, campaign sources, popular pages and user journeys.
- Operations: workload, delivery times, service requests, stock movement or project progress.
- Finance: revenue, costs, invoices, payment timing and budgets.
- Customer support: enquiries, recurring issues, response times and feedback.
Each source can answer part of a bigger question. For example, a sales team may see fewer enquiries, while website data shows that traffic is steady. Looking at both together can help you investigate whether the issue sits in the quality of incoming leads, the enquiry journey or the way your team follows up.
The value comes from connecting the information to a real business decision, not simply collecting more of it.
Start with the decision, not the dashboard
A dashboard is useful when it helps someone decide what to do next. Before choosing charts or metrics, ask:
- What decision do we need to make?
- Who needs to make it?
- What information would help them act with confidence?
- How often do they need to review it?
If you lead a sales team, your first question might be: “Which opportunities need attention this week?” If you run an online business, it could be: “Which channels bring enquiries that become customers?” An operations manager might ask: “Where does work spend the most time waiting?”
These questions are specific enough to guide your first analysis. They also help you avoid building a dashboard full of figures that look impressive but do not change anyone’s actions.

Choose measures that point to action
A metric should make the next step clearer. Website visits, social media likes and total leads can provide context, but they do not always show whether your business is moving towards its goals.
Pair activity measures with outcome measures. Instead of looking only at website traffic, review how many relevant visitors complete an enquiry and which sources bring those visitors. Instead of tracking pipeline value alone, look at opportunities by stage, age and expected close date. For operations, consider delivery time or open workload alongside the number of tasks completed.
Always give a metric enough context to be useful. A conversion rate needs a time period and a clear definition of what counts as a conversion. A revenue figure needs a source and a consistent way to distinguish booked revenue from money received.
When teams define the same measure differently, reports become harder to compare and trust. Agree on the meaning, source and owner of each key metric before making it part of a regular review.
Bring scattered information into one clear view
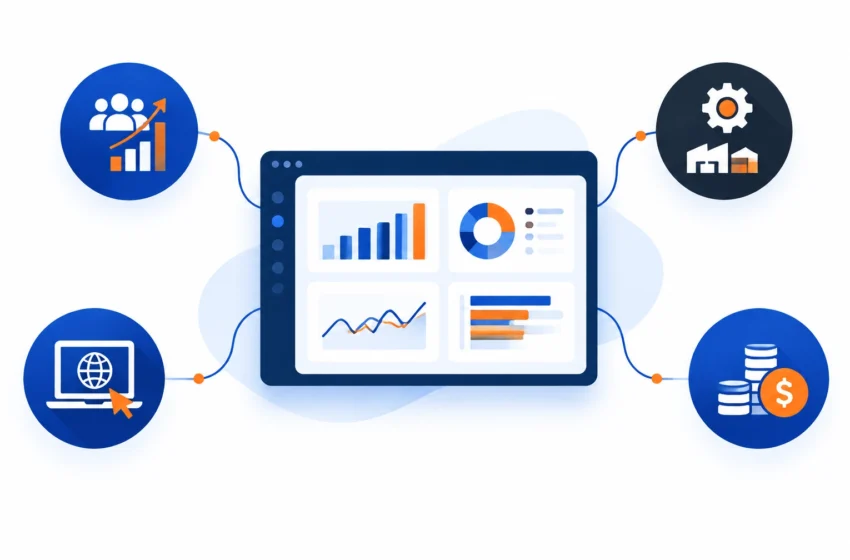
When important data sits in disconnected tools, teams can spend time reconciling reports instead of using them. A shared view helps you see how different parts of the business connect, for example, how a marketing source relates to enquiries, sales progress and revenue.
That does not mean every system needs replacing. The right approach depends on the tools you already use, how your data is structured and which decisions matter most. A focused analytics solution can help you connect relevant sources, create clear reporting and give the right people access to actionable information.
Anantek’s data analytics solutions start with your current data collection and reporting needs. We help you identify useful measures, improve how information is tracked and present findings through intuitive dashboards and reports.
If your business works across Microsoft tools, Microsoft 365 implementation and optimisation can also help make your working environment more connected and fit for purpose.
Build around the way your people work
Sometimes a standard report cannot show the information your team needs in the right context. A tailored interface can bring relevant data together around a specific role, workflow or customer journey.
With custom web app development, we can create a practical way for your team to view and use business information alongside the tools and processes they already rely on. For example, a customer-facing team may need a clear account view, while managers need a wider picture of performance across teams or locations.
For mobile teams, mobile app development services can support data capture and access while people work away from a desk. The aim is not to add technology for its own sake. It is to make useful information available where a decision needs to happen.

Avoid the common analytics traps
A few simple habits help you keep analytics focused and trustworthy.
Collecting data without a purpose
More data does not automatically lead to better decisions. Decide what question you want to answer first, then identify the information you need. This keeps the work practical and helps you avoid reports no one uses.
Treating vanity metrics as success
A high number can look encouraging without showing meaningful progress. Ask what the number represents, what outcome it connects to and what action follows if it changes. If nobody can answer those questions, keep it out of your core decision dashboard.
Leaving data in separate silos
When sales, marketing, finance and operations each report from different sources with different definitions, the business can end up with competing versions of the same story. Start by agreeing on key terms and identifying a reliable source for each important measure. Connect only the data that supports your chosen decisions.
Assuming every number is automatically reliable
Incomplete records, inconsistent labels and outdated information can all affect a report. Check whether critical data is complete, current and defined consistently. If a figure does not look right, investigate its source before acting on it.
A practical way to start small
You can make useful progress without analysing every part of your business at once:
- Choose one business question that comes up regularly.
- Identify the people who need the answer and the decision they need to make.
- Find the relevant data in your existing systems.
- Agree on a small set of measures and define what each one means.
- Create a focused report or dashboard that makes patterns easy to spot.
- Review it with the people who will use it and refine it based on their decisions.
For instance, a business could begin by reviewing the journey from website enquiry to completed sale. That may involve information from website forms, the CRM and finance records. A clear view of that journey gives the team a starting point for asking better follow-up questions and deciding where to focus.
As your needs develop, you can expand the analysis, connect additional sources or explore process automation where it supports a data-led workflow. The priority remains the same: make the information useful to the people making decisions.
Turn better questions into forward momentum
Data analytics does not replace your experience or judgement. It strengthens them with a clearer view of what is happening across your business. When you start with a defined question, use consistent measures and give your team a report they can act on, you move from guesswork towards confident, evidence-based decisions.
Whether you are exploring bespoke software development in the UK or looking for a software development company in London to support a connected digital strategy, we can help you make your data more usable. We take time to understand your business, your systems and the decisions you want to improve.
We’d love to talk about your data analytics needs and help you find a practical starting point.